South Pole
Contents
[hide]The Moon's South Pole
|
Lat: 90°S, Long: --, Rükl 73 | |
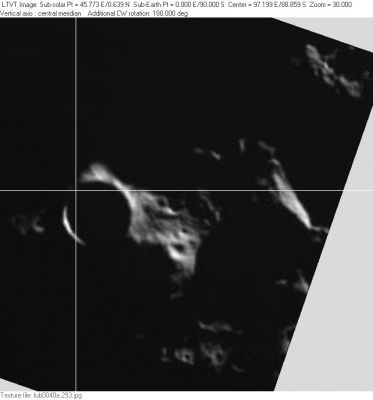
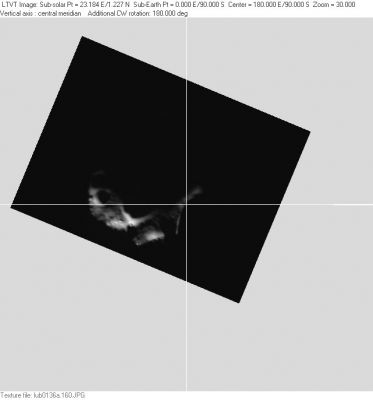
Right: (Clementine): In this closer view (reproduced at the same scale) the Sun is even lower – with a center 1.2° below the horizontal as seen from the pole – but it has swung around to angle where it shines down a little more from the top of the page. This brings into view a ridge to the west of Shackleton, previously lost in shadows, while hiding the previously visible ridge on the east. If the ULCN 2005 coordinates are correct, the Moon’s rotation axis is very close to a roughly 1 km diameter pit in Shackleton’s upper left rim (in this view). The sunlit ridge on the left connects Shackleton to nearby de Gerlache and is recognizable in both the LPOD images cited below.
(both images show the pole position based on ULCN 2005 points listed on the respective Clementine tiles)
Images
LPOD Photo Gallery SMART-1 mosaic Cornell-Smithsonian Radar Mosaic
- Apollo 15's B-and-W Hasselblad frame AS15-95-12988 could be the only Apollo photograph on which the lunar south pole's immediate environs are seen. The crater Malapert is visible near the central part of the frame's upper margin. The south pole itself must be "touching" the upper margin (or perhaps a little bit beyond the margin). A High-Resolution scan of this frame (of AS15-95-12988) is needed!
- Research: Danny Caes.
- Mosaic of LROC Narrow Angle Camera images of the south pole area.
- Animation of illumination changes over a 1-year period assembled from LROC Wide Angle Camera images.
Maps
(LAC zone 144D4) USGS Digital Atlas PDF
Description
Description: Wikipedia
Additional Information
- The south polar region as seen from Earth is nicely depicted in Ewen Whitaker's classic 1954 polar charts. Note, however, that the crater Whitaker shows just below the south pole is not Shackleton. Shackleton can be seen from Earth with a favorable libration, but it is located at a position between what Whitaker depicts as overlapping ridges just to the left of the point he marks "S. Pole". - JimMosher
- Mini-RFradar views

- Click image for larger view (~ 1.7 Mb)
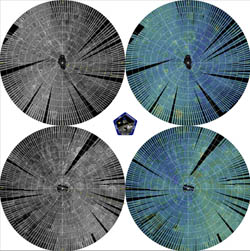
- Image above shows the first month's systematic polar mapping results obtained by the Mini-RF radar instrument onboard NASA's Lunar Reconnaissance Orbiter (LRO). The Mini-RF (Miniature Radio Frequency) instrument is specifically designed to map the lunar poles, and search for any potential water deposits that may lie hidden in permanently-shadowed craters. A similar instrument (Mini-SAR) was also launched in 2008 onboard the Indian spacecraft, Chandrayaan-1, that covered more than 90 precent of both polar regions. However, as that mission ended in August 2009, the data collected is used in tandem with this new data obtained by LRO. The images are mosaics of numerous images stitched together as taken by the Mini-RF, and cover regions from 70 degrees upwards to the poles (left-hand images = radar brightness, right-hand = circular polarisation ratio). - JohnMoore2
Topography
Here is a preliminary map of the topography within 5° (in latitude) of the Moon's south pole, created from data collected by the Kaguya laser altimeter as reported in the February 13, 2009 issue of Science magazine, with the current IAU feature names superimposed:

 <- click to see full-sized image

  Observers on Earth see this scene roughly as viewed looking up from the bottom, but with extreme foreshortening due to the highly oblique angle of view. The high resolution Kaguya laser data set has since been extended to reach 10° from the pole, but a new color-coded topo map covering the larger extent does not seem to have been issued.

  The Kaguya map is believed to be independent data based on celestial navigation of the spacecraft, but it agrees very well with the previous estimates of the pole's location. The misregistration of some of the circles representing the IAU names is due to the imprecise coordinates listed in the IAU database (which are intended only to be close enough for unambiguous identification).

  A more recent preliminary topographic map of the Moon's south pole from the LOLA altimeter experiment on LRO can be found on Goddard Spaceflight Center's Scientific Visualization Center pages (a simple stereographic projection, quite consistent with the Kaguya data, but covering a larger area, can be found as the last image).

  Informative, but still very preliminary, maps of both poles can also be found on the Diviner webpages -- another LRO instrument which, by imaging in the infrared can show topographic details in shadowed regions.
Features Visible From Earth
The following thumbnails link to images showing south-up three-dimensional simulations of the appearance of the Moon's south pole as seen from Earth with a maximum libration of -7° in latitude and with the Sun at its maximum southerly latitude of -1.6°. They were prepared using LTVT and the Kaguya south-polar digital elevation model. The nominal locations of the IAU feature names (not always accurate) are indicated by the white dots next to the names. The letters for the satellite features on the side towards the primary feature after which they are named.
The prominent shadow-casting peak between the Malapert and Haworth dots is the one Whitaker believes was the former Malapert Alpha, while the broader plateau to the left of Malapert (containing the Malapert E) is his Leibnitz Beta. Shackleton is the cinder-cone shaped crater on whose outer slope the IAU dot falls. Haworth is in the shadows between Malapert Alpha and Shackleton, mostly hidden by Malapert Alpha.
| Waxing |
Full |
Waning |
The image on the left shows the pole with the subsolar point 60° east of the prime meridian (colongitude 30°). The center image is a Full Moon condition with the sub-solar point at 0° longitude (colongitude 90°). The one on the right is with the sub-solar point at 60° west (colongitude 150°).
It is possible for observer's in the Earth's southern hemisphere to see the Moon's south pole with slightly more tilt; but the south polar features are never illuminated at a higher angle than that shown here.
The Pointers
- The two bowl-shaped high-albedo craters Simpelius J and Schomberger G (at approximately 76°S/ 8°E) are interesting targets during Full Moon because they act as "pointers" to get the location of the moon's South Pole, a bit like the celestial "pointers" in the Big Dipper asterism of the constellation Ursa Major which can be used to get the location of Polaris, the northern pole star. However they are not on exactly the same meridian of lunar longitude so the pointing is only approximate: with positive libration in longitude they point a bit to the west of the true pole. - DannyCaes Sep 18, 2010
Illuminated and Dark regions of the South Pole
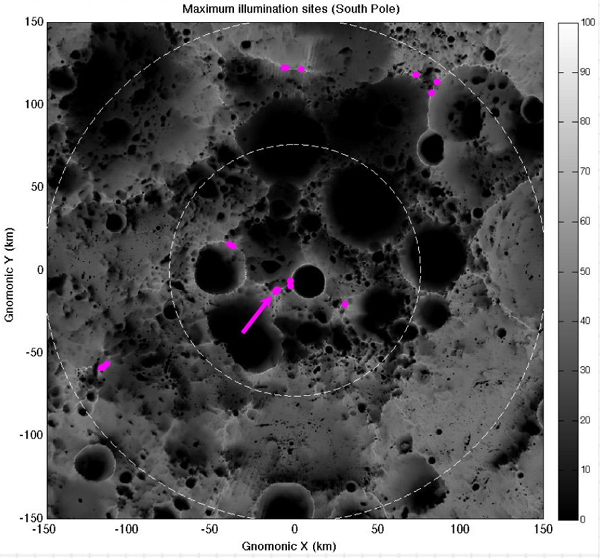
As the moon's rotational axis is only slightly tilted towards the Sun, certain areas at both lunar poles remain in nearly constant sunlight, while others remain in constant darkness (for example, inside some craters). Such sites could be of enormous advantage in the establishment of a lunar base, as the constant sunlight would provide a source for solar-cell power, while the dark regions may hold potential deposits of water-ice beneath the sub-surface soil. Image below shows the average solar illumination at the South Pole above 85 degrees. Permanently-shadowed regions appear as black, while the pink regions represent areas where the maximum amount of illumination occurs (arrrow shows the best location - Long 229.69E, Lat 89.45S - near Shackleton crater). The image below featured as one of the "Ten Cool Things Seen in the First Year of LRO" (see bottom of page in link). Further description about the image can be seen here; as it originally appeared on NASA's Exploration Highlights series (see No 29).

  Credit: NASA/Goddard
Nomenclature
- See Additional Information, above. Whitaker's 1954 paper introduced informal numeric designations for several south polar "mountains" as well as assigning possibly new meanings to the then-current, but since discontinued, IAU peak names associated with Malapert and the Leibnitz Mountains ("Malapert Alpha", "Leibnitz Beta", etc.).
- The Pointers (this is a nickname from D.Caes for the two bowl-shaped high albedo craters Schomberger G and Simpelius J at approximately 76 degrees south/ 7 degrees east, which are quite interesting targets during Full Moon, because they (both craters) act like "pointers" to get the location of the moon's South Pole. They are a bit like the celestial "pointers" in the well-known asterism Big Dipper of the constellation Ursa Major; to get the location of Polaris, the northern pole star).
LRO Articles
LPOD Articles
- 20 m Resolution! (shows the south polar region as illuminated by Earth-based radar waves, which can reach several degrees farther into the bowls of the craters than can sunlight)
- A View of our Future (the South Pole as seen from the Moon's farside -- Shackleton is in the foreground above JAXA/NHK logo)
- Mountains near the South Pole
- Mountains at the Pole - Terrestrial view
- The Deep South - drawing by Harry Roberts
- No Z (alphabetically arranged map of the southpole region, Hi-Res radar view)
Bibliography
- Mitchell, J. et al (2017). Using complementary remote sensing techniques to assess the presence of volatiles at the lunar north pole. - Planetary and Science - doi: 10.1016/j.pss.2017.07.015, 2017.
- Gläser, J. et al (2017). Illumination conditions at the lunar poles: Implications for future exploration. - Planetary and Science - doi.org/10.1016/j.pss.2017.07.006, 2017.
- Fisher, E. A. et al (2017). Evidence for surface water ice in the lunar polar regions using reflectance measurements from the Lunar Orbiter Laser Altimeter and temperature measurements from the Diviner Lunar Radiometer Experiment. - Icarus Vol 292, Pages 74–85, August 2017.
- Mandt, K. E. et al (2016). LRO-LAMP detection of geologically young craters within lunar permanently shaded regions. - Icarus Vol 273, 15 July 2016.
- Smith, D. E. et al (2016). THE LUNAR SOUTH POLAR CRUST. – 47th Lunar and Planetary Science Conference 21 - 25 March 2016.
- Siegler, M. A. et al. (2016). Lunar true polar wander inferred from polar hydrogen. - Nature, 531, pp. 480–484, (24 March 2016).
- Moriarty III, D. P. and Pieters, C. M. (2015). The nature and origin of Mafic Mound in the South Pole-Aitken Basin - Geophysical Research Letters First Published: 15 October 2015.
- De Rossa, D. et al (2012). Characterisation of Potential Landing Sites for the European Space Agency's Lunar Lander Project (PDF) – Earth and Planetary Astrophysics (arXiv:1208.5587v1 [astro-ph.EP]), Aug, 2012.
- A Portfolio of Lunar Drawings (Harold Hill), pages 188, 189 (the south polar regions).


