Cornell-Smithsonian Radar Mosaic
Contents
[hide]Cornell-Smithsonian Radar Mosaic
Description
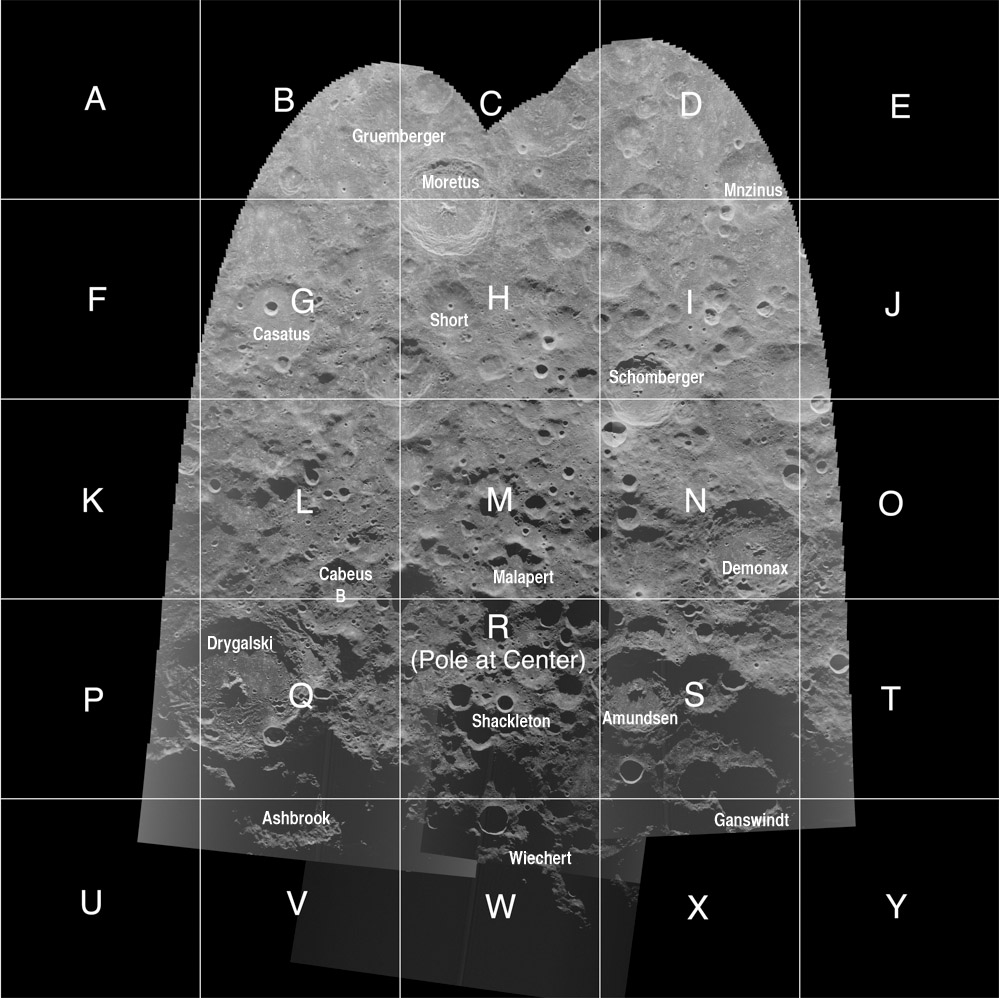
A 20 m resolution mosaic of the lunar South Polar region was constructed by scientists at Cornell University and the Smithsonian Institution using the Arecibo radio telescope (Puerto Rico) to transmit radar pulses and the Green Bank Telescope (West Virginia) to receive the echos. This mosaic has much less shadowing than any created with illumination by the Sun, and will remain the best view of this pole until an orbital radar mosaic is available. This image was released July 2, 2009. Each lettered square represents a high resolution pane of the defined area. The original data for each pane - available here - is 20 m resolution with file sizes greater than 100 MB. I have reduced each image to 1/12th of its original size for convenience in viewing, and identified one named feature in each pane to help navigate. The resolution is adequate for almost all applications except perhaps trying to select a safe landing site.

  For more technical information see "Additional Information".

  Click a letter here to see the individual panes: B, C, D, G, H, I, J, K+L, M, N, O, P+Q, R, S, T, V, W, X

 Image courtesy Cornell University/Smithsonian Institution.
Additional Information
Apparently no webpage yet exists describing this data so I have copied the press release distributed as an email by the Lunar & Planetary Institute.
Release of High-Resolution Radar Image Mosaic for the Moon's South Pole
A high-resolution S-band (12.6 cm wavelength) radar view of the lunar south pole, obtained using the NAIC Arecibo Observatory and the NRAO Green Bank Telescope (GBT), is now available for download. These data were acquired in 2005 and have a single-look spatial resolution of 20 m per pixel. The WEB site where the images can be obtained is http://arecibo.tc.cornell.edu/lunarimages/default.aspx
A circularly polarized signal was transmitted from Arecibo, and the echo was received at the GBT in both the opposite sense (OC) of circular polarization (i.e. the one expected for a mirror like reflection) and the same sense (SC) to that transmitted. The image available for download is the SC (same sense circular) polarization channel. The data are "focused", similar to synthetic aperture radar images, allowing for very fine spatial resolution over a large area. For more information about bistatic radar observations, focusing, and the S-band radar data set, see [D. Campbell et al. 2006, Nature, 443, 835] and [B. Campbell et al., 2007, IEEE Trans. Geosci. Rem. Sens., 45, 4032].
The radar echoes are mapped to power values proportional to the backscatter coefficient, scaled to a 60-dB dynamic range about an approximate mean power value for the entire map, and further scaled to an 8-bit range. Each DN value thus represents a power change of about 0.23 dB. A correction for the antenna beam pattern on the lunar surface is applied, but we do not correct for the dependence of backscatter strength on incidence angle or scattering area. The high dynamic range of the observations will reveal even modest folding of bright reflections across the Doppler axis of each run, and these appear as dim ghost crater walls in some shadowed areas. There is also a higher background noise level along the center of each focused image, which can be seen as a brighter stripe in each of the 3 mosaicked images, especially near the limb.
Three separate images were obtained across the south polar region and were mosaicked to produce the 60,000 by 60,000 pixel image. The separate images have slightly different noise levels in the shadowed terrain and there are some small imperfections in the mosaicking. For download purposes, this image has been separated into 25 contiguous quadrangles, each of which is 12,000 by 12,000 pixels (about 150 Mbytes) in size. The image is in a polar stereographic projection with a resolution of 20 meters per pixel. The south pole location, as indicated by the ephemeris information used in the observations, is at the center of mosaic quadrangle "R" (or at row=42,000, col=30,000 in the fully assembled map).
Image credits for these data should read "Courtesy Cornell University/Smithsonian Institution".
Requests for additional information may be directed to Bruce Campbell (Smithsonian Institution; campbellb@si.edu) or Don Campbell (Cornell University; campbell@astro.cornell.edu). The complete dual-channel dataset is being prepared for submission to the PDS.
This work was supported in part by a grant from NASA's Planetary Astronomy Program. We thank Lynn Carter and Kassie Wells for help with data acquisition and analysis and the staff at the Arecibo and Green Bank Observatories for invaluable assistance in collecting the lunar radar data. The Arecibo Observatory is part of the National Astronomy and Ionosphere Center (NAIC), which is operated by Cornell University under a cooperative agreement with the National Science Foundation (NSF). The Green Bank Telescope is part of the National Radio Astronomy Observatory (NRAO), a facility of the NSF operated under cooperative agreement by Associated Universities, Inc.
Calibrated Mosaic
For those who wish to explore additional features visible on this radar map, the panes have been combined into a single mosaic in orthographic projection uploaded to the LPOD Photo Gallery. It can be displayed interactively using the calibration information on this LTVT page.
LPOD Articles
Bibliography
