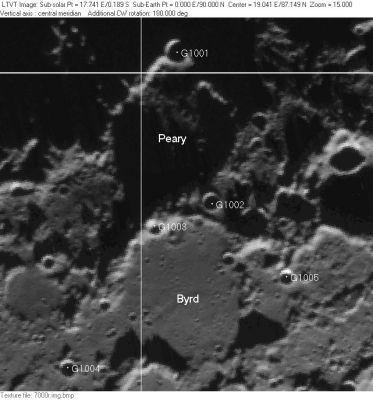
North Pole
Contents
The Moon's North Pole
|
Lat: 90.0°N, Long: --, Rükl 4 | |
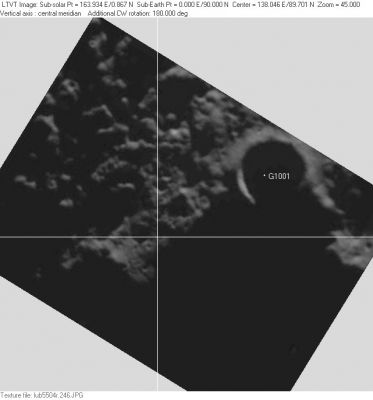
Right: Clementine Taken looking vertically down from 768 km. As seen from the pole, the Sun would have been shining from the Moon's farside with its center 0.9 degrees above the horizontal. The image has been matched to points of ULCN 2005 that were measured on this frame, resulting in a slight misregistration of the G1001/Whipple control point. The exact location of the Moon's north pole is probably uncertain by at least this much.
Images
LPOD Photo Gallery Smart-1 mosaic
- An intermediate image, showing the location of the North Pole on a Lunar Orbiter image registered to the 1994 ULCN is also available.
- Mosaic of LROC Narrow Angle Camera images of the north pole area.
- Animation of illumination changes over a 1-year period assembled from LROC Wide Angle Camera images.
Maps
(LAC zone 1A1) USGS Digital Atlas PDF Lunar Orbiter version
- note: the first of these two IAU nomenclature maps, using a color-coded shaded relief background, gives the impression that there is a crater of about the size of Hinshelwood tangent to the pole, and smaller craters between that and Whipple. These appear to be artistic artifacts. The Kaguya topo map (see below) shows no substantial craters at these locations.
Description
The Moon's north pole is the point at which its spin axis pierces the surface features at the end most northward as viewed from Earth. This axis is fixed relative to those features, although relative to the stars the direction of the spin axis precesses over a cycle of about 18.6 years.
Wikipedia
Additional Information
- The location of the spin axis defines the 90° point in the most common system of lunar ("selenographic") coordinates (the "Mean Earth/Polar" system). The actual position of the pole must be determined by experiment, and gradual improvements in locating it necessitate small refinements in the coordinates of all surface features (as do improvements in the location of the Mean Earth point).
- The Moon's north pole was designated a Constellation Program Region of Interest.
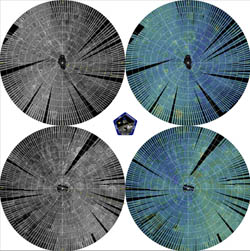
- Mini-RF radar views

- Click image for larger view (~ 1.7 Mb)
- Image above shows the first month's systematic polar mapping results obtained by the Mini-RF radar instrument onboard NASA's Lunar Reconnaissance Orbiter (LRO). The Mini-RF (Miniature Radio Frequency) instrument is specifically designed to map the lunar poles, and search for any potential water deposits that may lie hidden in permanently-shadowed craters. A similar instrument (Mini-SAR) was also launched in 2008 onboard the Indian spacecraft, Chandrayaan-1, that covered more than 90 precent of both polar regions. However, as that mission ended in August 2009, the data collected is used in tandem with this new data obtained by LRO. The images are mosaics of numerous images stitched together as taken by the Mini-RF, and cover regions from 70 degrees upwards to the poles (left-hand images = radar brightness, right-hand = circular polarisation ratio). - JohnMoore2
Topography
- The following image is a preliminary map of the topography within 5° (in latitude) of the Moon's north pole created from data collected by the Kaguya laser altimeter as reported in the February 13, 2009 issue of Science magazine, with all current IAU feature names superimposed:
- Observers on Earth see this scene roughly as viewed looking up from the bottom, but with extreme foreshortening due to the highly oblique angle of view.
- The Kaguya map is probably the best, and most accurate, information currently available regarding the locations and heights of the polar features. It is believed to be independent data based on celestial navigation of the spacecraft, but it agrees very well with the previous estimates of the pole's location. The misregistration of some of the circles representing IAU names is due to the imprecise coordinates listed in the IAU database (which are intended only to be close enough for unambiguous identification).
- Informative, but still very preliminary, maps of both poles can also be found on the Diviner webpages -- a LRO instrument which, by imaging in the infrared, can show topographic details in shadowed regions.
Features Visible From Earth
The following thumbnails link to images showing three-dimensional simulations of the appearance of the Moon's north pole as seen from Earth with a maximum libration of +7° in latitude and with the Sun at its maximum northerly latitude of +1.6°. They were prepared using LTVT and the Kaguya north-polar digital elevation model. The nominal locations of the IAU feature names (not always accurate) are indicated by the white dots next to the names. The letters for the satellite features on the side towards the primary feature after which they are named (one of the two "U's" in the upper right is Rozhdestvenskiy U, the other is Plaskett U; the "A" at the left is Hermite A).
| Waxing |
Full |
Waning |
The image on the left shows the pole with the subsolar point 60° east of the prime meridian (colongitude 30°). The center image is a Full Moon condition with the sub-solar point at 0° longitude (colongitude 90°). The one on the right is with the sub-solar point at 60° west (colongitude 150°).
It is possible for observer's in the Earth's northern hemisphere to see the Moon's north pole with slightly more tilt; but the north polar features are never illuminated at a higher angle than that shown here.
Example of an Earth-based View
As an example of an actual observation British amateur Stefan Lammel photographed the Moon's north pole from London on April 23, 2010 at 20:10 UT when the libration in latitude, from that site, was +5.39°. The first image is a portion of Stefan's photo, resized and rotated. The second is a simulation created with the LTVT software and the LOLA 240 m resolution polar DEM. The third is the same as the second, but with the full IAU nomenclature of the region automatically superimposed. The last image is an animation combining the previous three. Click on the thumbnails to see the full-sized images.
| Observed |
Simulation |
Nomenclature |
Animation |
As previously noted, the diameters of the automatic nomenclature ellipses give a good indication of the sizes of the named features, but the features themselves tend to be located above the positions at which the ellipses are plotted -- an effect most noticeable for the smaller craters such as Aepinus, Hermite A, and Erlanger. A small blue plus symbol marks the exact three dimensional location of the pole in the simulations. Since the topographic element responsible for each pixel in the simulations is precisely known, this position should be as accurate as the registration of the LOLA data itself. The simulation has been "juiced up," slightly, with a gamma correction of 1.5, bringing out small, dimly lit features that are difficult to capture photographically.

  To better understand what is being seen, it is helpful to "rectify" Stefan's Earth-based image and compared it to the simulated view expected looking directly down on the north pole under these lighting conditions. Here is what the immediate polar region looks like unrolled at the same scale:
| Rectified |
Simulation |
Peary is responsible for the large sunlit plain in the simulation. The circular shadowed crater to its lower left is Hermite A. Whipple is to the upper right of the blue polar plus mark, with Hinshelwood roughly half-way between them (but almost entirely in shadow).
In the simulation, the areas of the lunar surface that were in sunlight, but not visible from Earth (due to being blocked by intervening topography) are highlighted in red. The north pole surface point is not one of these, so it should visible in Stefan's photo, although nearly in shadow. The rectification is not perfect, but the general correspondence of features is evident. Setting the LTVT mouse options to display locations in the raw Earth-based image, one concludes that the north pole point in the simulation correspondends to approximately pixel (1766,134) in the x1.1 version of Stefan's photo.
LROC Articles
LPOD Articles
- North Polar Rays
- Over the Pole
- Not Santa's Pole
- A Mystery Crater
- A New View of the Limb
- North of the Pole
- The Whole Pole
- The Missing North Pole
- The Recovered Pole
- Beginning to see the unseen
Bibliography
- Mitchell, J. et al (2017). Using complementary remote sensing techniques to assess the presence of volatiles at the lunar north pole. - Planetary and Science - doi: 10.1016/j.pss.2017.07.015, 2017.
- Gläser, J. et al (2017). Illumination conditions at the lunar poles: Implications for future exploration. - Planetary and Science - doi.org/10.1016/j.pss.2017.07.006, 2017.
- Siegler, M. A. et all. (2016). Lunar true polar wander inferred from polar hydrogen. - Nature, 531, pp. 480–484, (24 March 2016).
- Detsis, E. Doule, O. and Ebrahimi, A. (2013). Location selection and layout for LB10, a lunar base at the Lunar North Pole with a liquid mirror observatory. - Acta Astronautica Vol 85, pp 61 - 72, DOI, April/May, 2013.


