Flyovers - An Introduction
Contents
Flyovers – An introduction
Description
This page describes one of the methods used to create three-dimensional (3-D) flyovers from two-dimensional (2-D) images of the lunar surface – obtained primarily by the Lunar Reconnaissance Orbiter (LRO) spacecraft. Production of a flyover is quite simple to achieve; once the necessary altimetric data is used in combination with a rendering/animation software that can convert 2-D images into a 3-D constructs. - JohnMoore2 Apr 13, 2011
Foundations
Three steps required:
- STEP 1. The first step one needs to take for a flyover is in the choosing of a particular region of the lunar surface. In this case, the region around the 66-km-wide farside crater, Buys-Ballot, (Lat 20.81N , Long 174.71E), was chosen, simply because it looked interesting (a detailed description of the crater’s possible formation is given here). Image of the crater was got from the wonderful, farside WAC mosaic shown in Fig 1 below; where it was, firstly, zoomed-in on (using the small bar at the bottom of the WAC page), secondly, a snap-shot taken (using the PrtScr button on a keyboard) and, thirdly, cropped and saved in the .tiff image format through Photoshop. The image was roughly 1,000 pixels x 1,000 pixels in width and height respectively (at 72 dpi), and in all the total size amounted to only ~ 6 Mb. Below, are shown the current set of available WAC mosaics of the Moon.
| Cylindrical |
Polar |
|
Long 0, Lat 0 |
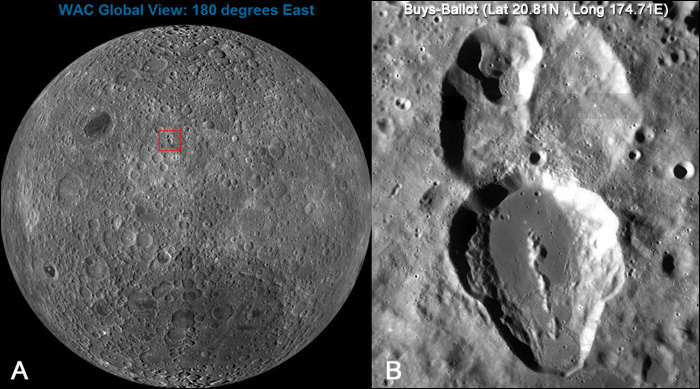
FIG 1 (A) WAC mosaic view of the moon’s farside showing the Buys-Ballot crater region highlighted in red box. (B) Zoomed-in view of the region. Images credit LROC.
- STEP 2. The second step, and more importantly an essential factor in producing a 3-D-platform for the Buys-Ballot region above, is in the obtaining of a grayscale texture of the same area. Grayscale textures represent the altimetric relationship between the highs and lows of an area on the lunar surface; where, dark grays equate to areas that are low, while light grays are those of higher regions. The textures are available in lists from the LOLA Data Archive, and are referred to as LOLA Digital Elevation Model (LDEM) files. They come in two image formats - the first is in IMG, and the second in JP2. As can be seen in Fig 2 below, each format varies in size, for example, the IMG file (highlighted in red box on the left) weighs in at 900 Mb, while the same file (on the right) is 93 Mb in size. Both formats, when presented in their grayscale form, will be in 16-bit (more about this in Note 2). Below, is shown the current set of available grayscale images of the Moon:
| Format |
Cylindrical |
Polar |
| IMG |
||
| JP2 |
- Note. Each file above also has an accompanying LBL file (mouse-cursor roved over each reveals which is which), and this MUST be put into the same folder where the IMG or JP2 file is originally downloaded to.

FIG 2 Comparisons in format sizes of the available LDEM files.
- Note. In the above links, you’ll also see additional files like LDEM 4, LDEM 16, LDEM 64, LDEM 128, LDEM 256, LDEM 512. The former four links will give you global perspective grayscale views of the Moon, while the latter two gives variation in specified degree regions of longitude. These numbers represent the points per degree of resolution, so the LDEM 4 file will have a lower resolution grayscale image than that of LDEM 1024. This doesn’t mean to imply that one should always download an LDEM 1024 file for a specific area because these will give the best possible resolution – the opposite, in fact. Unfortunately, some regions in the 1024s suffer from missed data points, so a lower resolved grayscale image might in the end be the better one to use – depending on what you’re after.
- STEP 3. All that is required now in the final step is in the choosing of the correct grayscale texture. As Buys-Ballot has coordinates Lat 20.81N and Long 174.71E respectively, the LOLA IMG file, LDEM 1024 15N 30N 150 180.IMG, available in the IMG Cylindrical list was downloaded into a folder, along with its accompanying LBL file LDEM 1024 15N 30N 150 180.LBL. In Fig 3 (A) below, an example of the grayscale texture for the Buys-Ballot region is shown. This was retrieved by using Bjorn Jonsson’s IMG2PNG free software, which took the LDEM 1024 15N 30N 150 180.IMG file and converted it into a PNG image (a graphic image format commonly used today). The actual size of this grayscale image was 30,720 pixels x 15,360 pixel in width and height respectively, and by doing the same ‘zooming-in’, ‘snap-shot’, ‘cropping’ and ‘saving’ procedures mentioned in Step 1 above, a 1,000 pixel x 1,000 pixel grayscale image of the Buys-Ballot region was created.
- Note 1. The IMG version of the above-mentioned LDEM files was chosen simply because the author uses IMG2PNG regularly, however, it is also possible to do the same conversion on the JP2 files using purchasable softwares like Adobe Photoshop.
- Note 2. Both the IMG and JP2 grayscale versions are available in the 16-bit per sampled pixel format only. Generally, most images used today normally are saved in the 8-bit format for B/W, while for colour it’s 24-bit (that is, 8-bit for each of the three colours Red, Green and Blue). As a comparison, and avoiding the technicalities, if an 8-bit grayscale image is used in this demonstration, the number of grays available would amount to 256 different intensities (and so, 256 individual altimetric heights could be represented). However, by using a 16-bit grayscale image (as is in both the IMG and JP2 formats above), the intensities amount to 65,536 different grays (and so, 65,536 individual altimetric heights could be represented). As such, the detail is much better in a 16-bit grayscale image than it is an 8-bit grayscale image (see Fig 4 below). Unfortunately, for most of us, opening 16-bit images will be a problem. Several softwares, for example, the purchasable Photoshop package mentioned above can do, or the PaintShop Photo Pro package is also capable. One could also use some of the freewares out there, like ImageJ or Irfanview, however, as these may require additional tweaking or plugins afterwards, it is well worth looking into before downloading. Use or download of softwares is at users own risk.
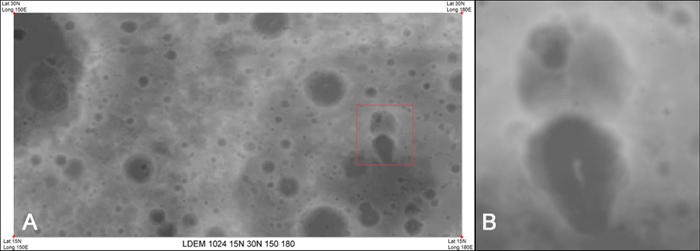
FIG 3 (A) Grayscale texture of the LDEM file containing the Buys-Ballot region highlighted in red box. (B) Close-up view of the crater’s grayscale representation. Images credit LOLA Data Archive.
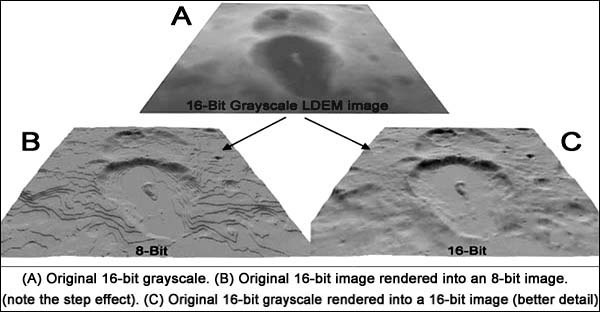
FIG 4 An example of how 16-bit and 8-bit images could affect the final rendered image.
Renderings
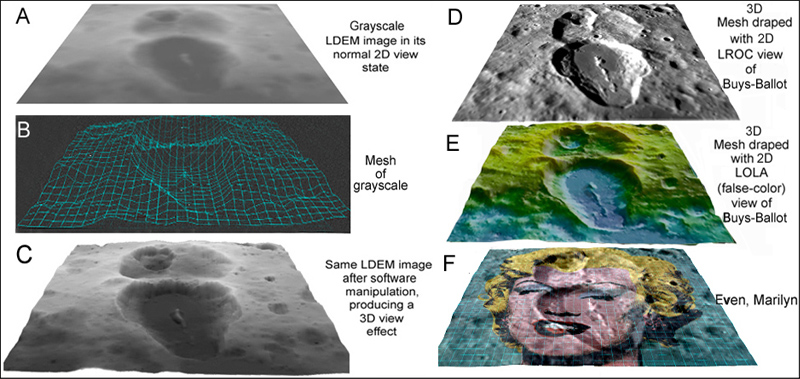
In order now to turn the above 2-D LROC and 2-D LOLA images of the Buys-Ballot region into a 3-D model for a flyover presentation, a rendering/animation software specifically designed for terrain purposes is required. Such softwares are usually used for turning satellite data and imagery (e.g. the Earth, the Moon, the planets and their moons) into 3-D virtual constructs. Softwares like these can show detail about certain areas in question that is hard to see in 2-D views, and scientists use then all the time while looking at, say, the structural, erosional, mineralogical aspects of a terrain (their uses are limitless). There are hundreds of rendering/animation softwares (both free and purchasable) that could be used for this demonstration, however, as there is as many different computing operating systems out there as there are computer users, none will be recommended here. Perhaps these Commercial and Non-Commercial terrain packages available might be worth looking into. Again, use or download of softwares is at users own risk, so it is recommended that some inquiry be done beforehand to see which software suits individual needs.

  Having chosen, however, a software that suits this flyover introduction, the 2-D LOLA grayscale image of the Buys-Ballot region attained in Steps 2 and 3 was now rendered (shown in Fig 5 below). The software’s algorithm has determined the intensity values of each pixel relative to its colour of gray, and assigned a numeric value of height to them. It then created a 3-D mesh for the entire scene from the values acquired, and it’s this mesh that lays the foundations for draping any image upon it, for example, the LROC image obtained in Step 1 above.


 FIG 5 An example on how a rendering/animation software can turn a 2-D grayscale image into a 3-D construct, allowing any image to be draped upon it.

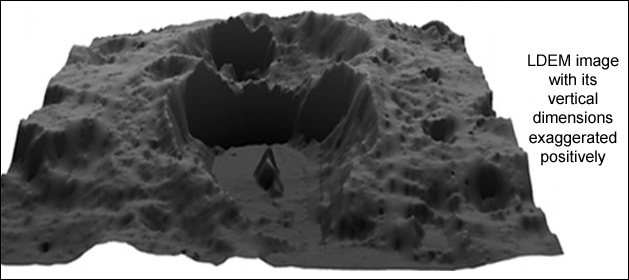
  The 3-D construct can also be adjusted up or down accordingly to the algorithm (having first averaged-out a particular gray intensity with value of zero). So, depending on the software’s additional tools and options, changing the data’s ‘dimensions’ both positively or negatively (as seen in Fig 6) is also possible.


 FIG 6 The 3-D image here has been exaggerated in the vertical (z-direction) by approximately 10x.
Flyover
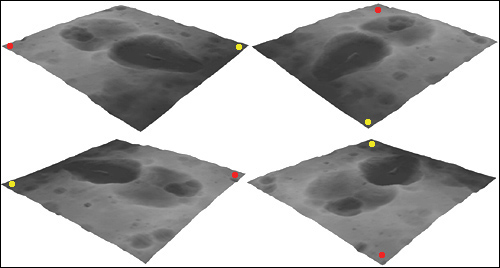
Now if the software’s algorithm above has encompassed all the necessary gray and altimetric values of data, then it should also be a simple case of viewing the 3-D construct from any angle and direction. Shown in Fig 7 below, one can see a software can be used to rotate, move up or down, send forwards or pull backwards, a 3-D construct in any direction with the simplest of movements.


 FIG 7 Just four snapshots of the same region from any angle – a basis for the flyover.

  Such movements could be interpreted like we see in a movie sequence where they become used like a virtual-like camera taking individual snapshots along the way. This is indeed on how the ‘flyover’ is achieved, whereby a ‘flight-path’ for the camera is first created, and so as the camera moves along the path, a series of pictured areas of the 3-D construct is taken (that is, rendered), which are then compiled together afterwards and saved in the required video format (e.g. AVI, MPG, MOV etc.,). In Fig 8 below, control of the direction that the flight takes is easily achieved by adjustment of the path from different aspect views (the small ‘top’, ‘side’ and ‘front’ windows below in Fig 8). In the main window, tweaking and correction for speed and direction can also be done, while other finer adjustments are possible, too. For this demonstration, the simplest were used.

  And that’s it in a nutshell! The ‘flyover’ at this stage has been created using all of the necessary resources and suggestions mentioned above (notes 1 and 2 below give some additional details).
- Note 1.The amount of frames per second (fps) that the eye can comprehend as normal movement is 24 fps, so any frames added or taken away from that figure will render a flyover scene that is either too slow or too fast respectively.
- Note 2. The only problem today in rendering flyovers is that a lot of computer power (e.g. good graphic cards, speed, ram...etc.,) can make producing them very time-consuming (the longer the flyover is, the more frames that have to be rendered). There are, of course, several compression techniques and adjustments that can be made to reduce the time and power, however, none were used here for this demonstration.
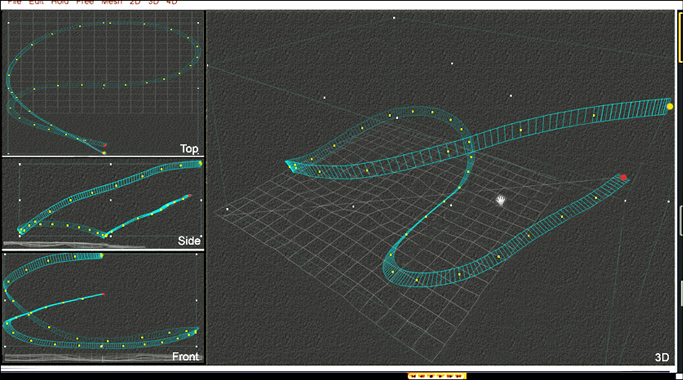
FIG 8 Construction of the flyover using different aspect views to create a flight-path for a virtual camera.
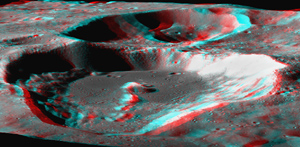
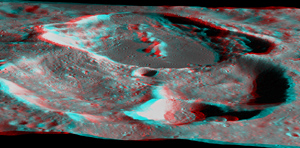
To finish, as the flyover created above essentially consists of a series of frames taken at different times throughout its flight-path, then it should be possible to produce a series of anaglyphs for any viewpoint from them. All one need do is use one snapshot taken at a particular time, say, 3.5 seconds into the sequence, and then use another snapshot at time, say, 4.0 seconds, and then combine them together into an anaglyph (easily done using the freeware, Anaglyph Maker) that is really in 3-D. See Figs 9, 10 and 11 below as an example.
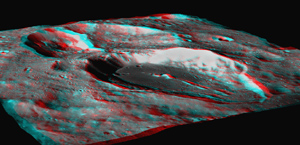 <– click to enlarge (Red/Blue glasses required)
FIG 9
 <– click to enlarge (Red/Blue glasses required)
FIG 10
 <– click to enlarge (Red/Blue glasses required)
FIG 11
Resources
As of writing (13 April 2011), the included YouTube flyover video was available at the following address –> http://www.youtube.com/watch?v=jGzmf7IzCTE&feature=mfu_in_order&list=UL. Apologies if on reading this article sometime later that the video has since been removed by that Network - as sometimes happens when non-control of an account is closed.


 Final Note. This is just one simple method used to create a 3-D flyover, however, if you should feel that additional information could be included towards other methods used today, then please feel free to use the ‘Edit’ button above.
Additional Information
- See Buys-Ballot
LPOD Articles
Bibliography
- Morota, T. et al (2011). Timing and Duration of Mare Volcanism in the Central Region of the Northern Farside of the Moon - Earth Planets Space, 63, 5–13, 2011
- Schultz, P. H. et al (1998). The Possible Generation of Friction Melts at the Lunar Crater, Buys-Ballot – 29th Lunar and Planetary Science Conference, 1998.

