Difference between revisions of "LPOD Miscellany"
| (One intermediate revision by the same user not shown) | |||
| Line 2: | Line 2: | ||
=Miscellany 1= | =Miscellany 1= | ||
<br /> It has been suggested that it would be useful to have a place for occasional images from LPOD that have been annotated to aid in discussion. Let's try it. If we get more than a few images here this page should become a table of contents linking to other pages with images. '''Note''', due to page changes here, another [[Miscellany2|Miscellany2]] page has been created which may also relate to links posted in discussions in LPOD. If you would like to add an image and text to this page relevant to an LPOD, then please see directions at end of this page for help (it's so simple).<br /> <div id="toc"> | <br /> It has been suggested that it would be useful to have a place for occasional images from LPOD that have been annotated to aid in discussion. Let's try it. If we get more than a few images here this page should become a table of contents linking to other pages with images. '''Note''', due to page changes here, another [[Miscellany2|Miscellany2]] page has been created which may also relate to links posted in discussions in LPOD. If you would like to add an image and text to this page relevant to an LPOD, then please see directions at end of this page for help (it's so simple).<br /> <div id="toc"> | ||
| − | + | ||
| − | |||
==Rupes Recta== | ==Rupes Recta== | ||
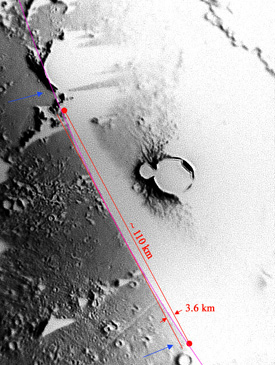
| − | Below is an inverted view of [http://lpod.wikispaces.com/March%207%2C%202009 Simon Kidd's wonderful image of Rupes Recta - March 7 2009 LPOD]. The two red lines were drawn in just to measure approximately the distance between the curve of the wall away from a straight edge, while the curved pink line was set as close as possible to find the curvature and approximate radius of the fault (by the current scale used, that radius worked out at about 591 km). The two blue arrows show two rilles that were a bit hard to see in the normal-taken photograph. See more on [[Straight%20Wall|Rupes Recta]].<br /> [[Image: | + | Below is an inverted view of [http://lpod.wikispaces.com/March%207%2C%202009 Simon Kidd's wonderful image of Rupes Recta - March 7 2009 LPOD]. The two red lines were drawn in just to measure approximately the distance between the curve of the wall away from a straight edge, while the curved pink line was set as close as possible to find the curvature and approximate radius of the fault (by the current scale used, that radius worked out at about 591 km). The two blue arrows show two rilles that were a bit hard to see in the normal-taken photograph. See more on [[Straight%20Wall|Rupes Recta]].<br /> [[Image:Straightwall2.jpg|straightwall2.jpg]]<br /> <br /> |
==Slope/Ht of Wichmann Swell== | ==Slope/Ht of Wichmann Swell== | ||
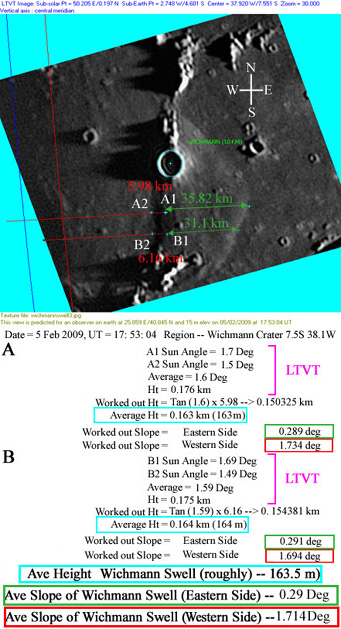
| − | In reference to [http://lpod.wikispaces.com/March%2020%2C%202009 LPOD 20 March 2009]. Image below shows the average slope and height of the Wichmann Swell. Measurements were taken using four arbitrary points (A1, A2 and B1, B2) of shadow contacts on the summit of the swell using the [http://ltvt.wikispaces.com/LTVT LTVT software]. As defining where the shadows started and ended was difficult, the below estimates are just that -- estimates. Note, the LTVT height (Ht) measurements below are much more accurate than those worked out using the trigometric method, as it takes into account the curvature of the moon's surface on which the shadows fall (the trigometric method assumes a straight surface). The eastern and western slopes would therefore be more precise using these LTVT heights 'only'. Using the average heights below serves merely as a nice demonstration and comparison. More on [[Wichmann|Wichmann crater]]<br /> [[Image: | + | In reference to [http://lpod.wikispaces.com/March%2020%2C%202009 LPOD 20 March 2009]. Image below shows the average slope and height of the Wichmann Swell. Measurements were taken using four arbitrary points (A1, A2 and B1, B2) of shadow contacts on the summit of the swell using the [http://ltvt.wikispaces.com/LTVT LTVT software]. As defining where the shadows started and ended was difficult, the below estimates are just that -- estimates. Note, the LTVT height (Ht) measurements below are much more accurate than those worked out using the trigometric method, as it takes into account the curvature of the moon's surface on which the shadows fall (the trigometric method assumes a straight surface). The eastern and western slopes would therefore be more precise using these LTVT heights 'only'. Using the average heights below serves merely as a nice demonstration and comparison. More on [[Wichmann|Wichmann crater]]<br /> [[Image:Wichmannswell2.jpg|wichmannswell2.jpg]]<br /> Original image: George Tarsoudis<br /> <br /> |
==A Ghost Basin Rim?== | ==A Ghost Basin Rim?== | ||
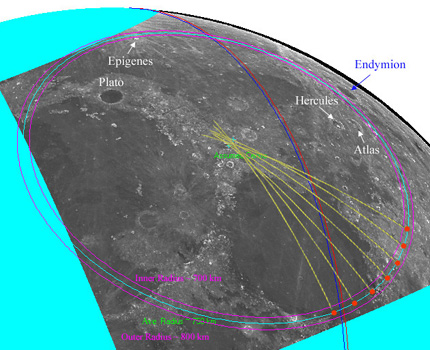
Image below shows the region and diameter of a possible ghost basin rim -- as posed on [http://lpod.wikispaces.com/April%206%2C%202009 LPOD April 6 2009]. The measurements were produced using Jim Mosher's [http://ltvt.wikispaces.com/LTVT LTVT] software, and were based, roughly, around short arcs (represented here by red dots) on the LPOD image, which suggested/represented a portion of the possible ghost basin rim. The diameter of the basin worked out at 1500 km -- centred on an assumed point estimated where lines (yellow) drawn perpendicularly back in from the several short arc points converged.<br /> [[Image:GhostRim.jpg|GhostRim.jpg]]<br /> <br /> | Image below shows the region and diameter of a possible ghost basin rim -- as posed on [http://lpod.wikispaces.com/April%206%2C%202009 LPOD April 6 2009]. The measurements were produced using Jim Mosher's [http://ltvt.wikispaces.com/LTVT LTVT] software, and were based, roughly, around short arcs (represented here by red dots) on the LPOD image, which suggested/represented a portion of the possible ghost basin rim. The diameter of the basin worked out at 1500 km -- centred on an assumed point estimated where lines (yellow) drawn perpendicularly back in from the several short arc points converged.<br /> [[Image:GhostRim.jpg|GhostRim.jpg]]<br /> <br /> | ||
==Central Peak (CP)== | ==Central Peak (CP)== | ||
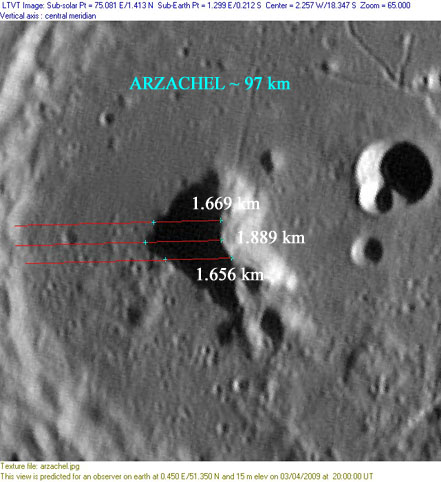
| − | Image below concerns the height of Arzachel's central peak -- in reference to [http://lpod.wikispaces.com/April%208%2C%202009 8 April 2009 LPOD image] taken by Damian Peach. Using the [http://ltvt.wikispaces.com/LTVT LTVT] software to measure the length of the shadows cast - heights for three points along its ridge came out as shown below. For more on previous estimates of the CP height of Arzachel see [http://digidownload.libero.it/glrgroup/selenologytoday12.pdf Selenology Today Vol 12 p9] and the [[Arzachel|Arzachel]] page on WikiMoon.<br /> [[Image: | + | Image below concerns the height of Arzachel's central peak -- in reference to [http://lpod.wikispaces.com/April%208%2C%202009 8 April 2009 LPOD image] taken by Damian Peach. Using the [http://ltvt.wikispaces.com/LTVT LTVT] software to measure the length of the shadows cast - heights for three points along its ridge came out as shown below. For more on previous estimates of the CP height of Arzachel see [http://digidownload.libero.it/glrgroup/selenologytoday12.pdf Selenology Today Vol 12 p9] and the [[Arzachel|Arzachel]] page on WikiMoon.<br /> [[Image:Arzachel1.jpg|arzachel1.jpg]]<br /> Image credit: Damian Peach<br /> <br /> |
==Sirsalis Z Mt== | ==Sirsalis Z Mt== | ||
| − | The heights given below for the mountains near Sirsalis Z [http://lpod.wikispaces.com/April%2012%2C%202009 see April 12 2009 LPOD] were found using the [http://ltvt.wikispaces.com/LTVT LTVT] software. Note the points from which the measurements were taken are approximate as seeing conditions at where shadows started and where they ended was difficult due to the low sun angle involved. More on [[Sirsalis|Sirsalis]].<br /> [[Image: | + | The heights given below for the mountains near Sirsalis Z [http://lpod.wikispaces.com/April%2012%2C%202009 see April 12 2009 LPOD] were found using the [http://ltvt.wikispaces.com/LTVT LTVT] software. Note the points from which the measurements were taken are approximate as seeing conditions at where shadows started and where they ended was difficult due to the low sun angle involved. More on [[Sirsalis|Sirsalis]].<br /> [[Image:Sirsal1.jpg|sirsal1.jpg]]<br /> Image: Credit - Carmello Mel Zannelli<br /> <br /> |
==Albategnius Peak== | ==Albategnius Peak== | ||
| − | The central peak in [[Albategnius|Albategnius]] has a small crater on it, so measurement of its height at this point is somewhat difficult. However, as a good measurement could be made possible just north of the crater using the sharp shadow-point projected just to the left, the height here came out at approximately 1.7 km (1735 m) using the [http://ltvt.wikispaces.com/LTVT LTVT] software. The slope for the eastern side directly below the height mentioned (between the aqua points) worked out at approximately 23.6 degrees. Note, that as the tip of the shadow falls on the outside of [[Klein|Klein]] crater (on left of image), outer crater material there may cause the shadow to end more abruptly shorter than were it to fall on Albategnius's floor. The LTVT measurement represents the difference in heights between these two points. Since the floor of Albategnius is lower than the shadow end point, both the difference in height between the peak and the crater floor, as well as the slope of the eastern side, are a little greater than estimated here. Photos in which the tip of the shadow from the central peak fall on the crater floor give a height difference of about 1.8 km. In reference to [http://lpod.wikispaces.com/April%2024%2C%202009 24 April 2009] LPOD.<br /> [[Image: | + | The central peak in [[Albategnius|Albategnius]] has a small crater on it, so measurement of its height at this point is somewhat difficult. However, as a good measurement could be made possible just north of the crater using the sharp shadow-point projected just to the left, the height here came out at approximately 1.7 km (1735 m) using the [http://ltvt.wikispaces.com/LTVT LTVT] software. The slope for the eastern side directly below the height mentioned (between the aqua points) worked out at approximately 23.6 degrees. Note, that as the tip of the shadow falls on the outside of [[Klein|Klein]] crater (on left of image), outer crater material there may cause the shadow to end more abruptly shorter than were it to fall on Albategnius's floor. The LTVT measurement represents the difference in heights between these two points. Since the floor of Albategnius is lower than the shadow end point, both the difference in height between the peak and the crater floor, as well as the slope of the eastern side, are a little greater than estimated here. Photos in which the tip of the shadow from the central peak fall on the crater floor give a height difference of about 1.8 km. In reference to [http://lpod.wikispaces.com/April%2024%2C%202009 24 April 2009] LPOD.<br /> [[Image:Albategnius.jpg|albategnius.jpg]]<br /> Image Credit: Steffan Lammel<br /> <br /> |
==Humboldt Fractures== | ==Humboldt Fractures== | ||
| − | The fractures on Humboldt's floor show signs of possible uplift, as well as showing some dark mantling (roughly at 2 o' clock and 8 o' clock positions). Image has South up, East left, in reference to [http://lpod.wikispaces.com/April%2029%2C%202009 LPOD April 29 2009], and was 'stretched' (literally, pushing towards an aerial view) using the [http://ltvt.wikispaces.com/LTVT LTVT] software. The inset image from LO4-027H1 shows the above-mentioned features more clearly. More on [[Humboldt|Humboldt]].<br /> [[Image: | + | The fractures on Humboldt's floor show signs of possible uplift, as well as showing some dark mantling (roughly at 2 o' clock and 8 o' clock positions). Image has South up, East left, in reference to [http://lpod.wikispaces.com/April%2029%2C%202009 LPOD April 29 2009], and was 'stretched' (literally, pushing towards an aerial view) using the [http://ltvt.wikispaces.com/LTVT LTVT] software. The inset image from LO4-027H1 shows the above-mentioned features more clearly. More on [[Humboldt|Humboldt]].<br /> [[Image:Humboldt.jpg|humboldt.jpg]]<br /> Image Credit: Pavel Presnyakov<br /> <br /> |
==Impact Basins== | ==Impact Basins== | ||
The image below shows a line of basins in reference to [http://lpod.wikispaces.com/May%201%2C%202009 1 May 2009 LPOD].<br /> [[Image:Kaguyafarsmall.jpg|Kaguyafarsmall.jpg]]<br /> Image Credit: JAXA/Kaguya<br /> <br /> The name [[Dirichlet-Jackson%20Basin|Dirichlet-Jackson]] has been informally proposed for the feature labeled "Basin???" See the [[Lunar%20Basins%20List|Lunar Basins List]] for unofficial names of other basins visible in this view.<br /> <br /> <u>ADDING TEXT & IMAGE TO THIS PAGE</u><br /> Just like as in the WikiMoon pages all you have to do is:<br /> (1)Click on 'Edit This Page' above,<br /> (2)Place the cursor on the page on where you want the image to appear,<br /> (3)Click the green icon (just left of the blue-looking TV icon) on the top, and click on 'Upload Files' and 'Browse',<br /> (4)Find the image in your own file system on your own computer, and open it,<br /> (5)Clicking on 'Upload' will install a small version of your image, and to insert it all you have to do is do a 'double-click' on it -- you're done....the image appears in the main page!<br /> (6) Add some text, and to finish, just click 'Save'.<br /> If you need to re-edit it later, just go to 'Edit This Page' again. You can experiment around as much as you like, until you're satisfied with the final version. Don't worry, you won't be criticised for your effort or anything like that, but your contribution will certainly be appreciated. </div> | The image below shows a line of basins in reference to [http://lpod.wikispaces.com/May%201%2C%202009 1 May 2009 LPOD].<br /> [[Image:Kaguyafarsmall.jpg|Kaguyafarsmall.jpg]]<br /> Image Credit: JAXA/Kaguya<br /> <br /> The name [[Dirichlet-Jackson%20Basin|Dirichlet-Jackson]] has been informally proposed for the feature labeled "Basin???" See the [[Lunar%20Basins%20List|Lunar Basins List]] for unofficial names of other basins visible in this view.<br /> <br /> <u>ADDING TEXT & IMAGE TO THIS PAGE</u><br /> Just like as in the WikiMoon pages all you have to do is:<br /> (1)Click on 'Edit This Page' above,<br /> (2)Place the cursor on the page on where you want the image to appear,<br /> (3)Click the green icon (just left of the blue-looking TV icon) on the top, and click on 'Upload Files' and 'Browse',<br /> (4)Find the image in your own file system on your own computer, and open it,<br /> (5)Clicking on 'Upload' will install a small version of your image, and to insert it all you have to do is do a 'double-click' on it -- you're done....the image appears in the main page!<br /> (6) Add some text, and to finish, just click 'Save'.<br /> If you need to re-edit it later, just go to 'Edit This Page' again. You can experiment around as much as you like, until you're satisfied with the final version. Don't worry, you won't be criticised for your effort or anything like that, but your contribution will certainly be appreciated. </div> | ||
Latest revision as of 01:58, 16 April 2018
Contents
Miscellany 1
It has been suggested that it would be useful to have a place for occasional images from LPOD that have been annotated to aid in discussion. Let's try it. If we get more than a few images here this page should become a table of contents linking to other pages with images. Note, due to page changes here, another Miscellany2 page has been created which may also relate to links posted in discussions in LPOD. If you would like to add an image and text to this page relevant to an LPOD, then please see directions at end of this page for help (it's so simple).
Rupes Recta
Below is an inverted view of Simon Kidd's wonderful image of Rupes Recta - March 7 2009 LPOD. The two red lines were drawn in just to measure approximately the distance between the curve of the wall away from a straight edge, while the curved pink line was set as close as possible to find the curvature and approximate radius of the fault (by the current scale used, that radius worked out at about 591 km). The two blue arrows show two rilles that were a bit hard to see in the normal-taken photograph. See more on Rupes Recta.
Slope/Ht of Wichmann Swell
In reference to LPOD 20 March 2009. Image below shows the average slope and height of the Wichmann Swell. Measurements were taken using four arbitrary points (A1, A2 and B1, B2) of shadow contacts on the summit of the swell using the LTVT software. As defining where the shadows started and ended was difficult, the below estimates are just that -- estimates. Note, the LTVT height (Ht) measurements below are much more accurate than those worked out using the trigometric method, as it takes into account the curvature of the moon's surface on which the shadows fall (the trigometric method assumes a straight surface). The eastern and western slopes would therefore be more precise using these LTVT heights 'only'. Using the average heights below serves merely as a nice demonstration and comparison. More on Wichmann crater

  Original image: George Tarsoudis
A Ghost Basin Rim?
Image below shows the region and diameter of a possible ghost basin rim -- as posed on LPOD April 6 2009. The measurements were produced using Jim Mosher's LTVT software, and were based, roughly, around short arcs (represented here by red dots) on the LPOD image, which suggested/represented a portion of the possible ghost basin rim. The diameter of the basin worked out at 1500 km -- centred on an assumed point estimated where lines (yellow) drawn perpendicularly back in from the several short arc points converged.
Central Peak (CP)
Image below concerns the height of Arzachel's central peak -- in reference to 8 April 2009 LPOD image taken by Damian Peach. Using the LTVT software to measure the length of the shadows cast - heights for three points along its ridge came out as shown below. For more on previous estimates of the CP height of Arzachel see Selenology Today Vol 12 p9 and the Arzachel page on WikiMoon.

  Image credit: Damian Peach
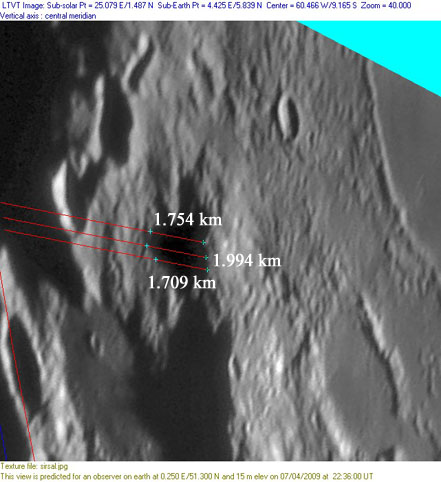
Sirsalis Z Mt
The heights given below for the mountains near Sirsalis Z see April 12 2009 LPOD were found using the LTVT software. Note the points from which the measurements were taken are approximate as seeing conditions at where shadows started and where they ended was difficult due to the low sun angle involved. More on Sirsalis.

  Image: Credit - Carmello Mel Zannelli
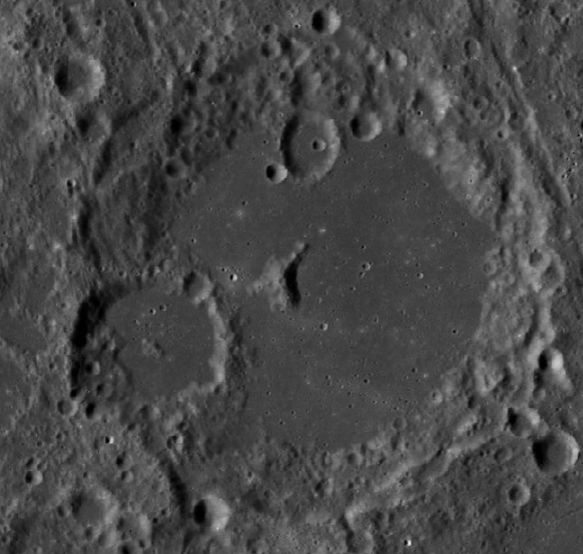
Albategnius Peak
The central peak in Albategnius has a small crater on it, so measurement of its height at this point is somewhat difficult. However, as a good measurement could be made possible just north of the crater using the sharp shadow-point projected just to the left, the height here came out at approximately 1.7 km (1735 m) using the LTVT software. The slope for the eastern side directly below the height mentioned (between the aqua points) worked out at approximately 23.6 degrees. Note, that as the tip of the shadow falls on the outside of Klein crater (on left of image), outer crater material there may cause the shadow to end more abruptly shorter than were it to fall on Albategnius's floor. The LTVT measurement represents the difference in heights between these two points. Since the floor of Albategnius is lower than the shadow end point, both the difference in height between the peak and the crater floor, as well as the slope of the eastern side, are a little greater than estimated here. Photos in which the tip of the shadow from the central peak fall on the crater floor give a height difference of about 1.8 km. In reference to 24 April 2009 LPOD.

  Image Credit: Steffan Lammel
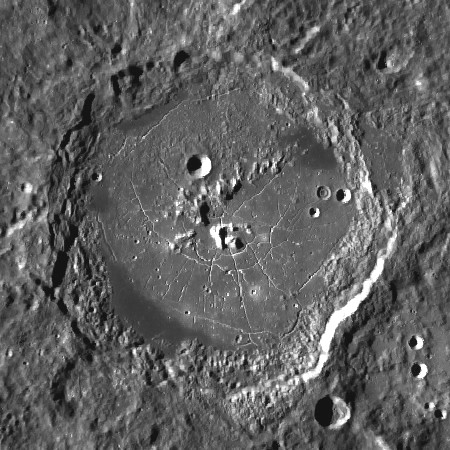
Humboldt Fractures
The fractures on Humboldt's floor show signs of possible uplift, as well as showing some dark mantling (roughly at 2 o' clock and 8 o' clock positions). Image has South up, East left, in reference to LPOD April 29 2009, and was 'stretched' (literally, pushing towards an aerial view) using the LTVT software. The inset image from LO4-027H1 shows the above-mentioned features more clearly. More on Humboldt.

  Image Credit: Pavel Presnyakov
Impact Basins
The image below shows a line of basins in reference to 1 May 2009 LPOD.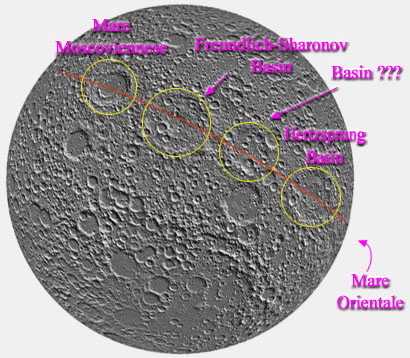
Image Credit: JAXA/Kaguya
The name Dirichlet-Jackson has been informally proposed for the feature labeled "Basin???" See the Lunar Basins List for unofficial names of other basins visible in this view.
ADDING TEXT & IMAGE TO THIS PAGE
Just like as in the WikiMoon pages all you have to do is:
(1)Click on 'Edit This Page' above,
(2)Place the cursor on the page on where you want the image to appear,
(3)Click the green icon (just left of the blue-looking TV icon) on the top, and click on 'Upload Files' and 'Browse',
(4)Find the image in your own file system on your own computer, and open it,
(5)Clicking on 'Upload' will install a small version of your image, and to insert it all you have to do is do a 'double-click' on it -- you're done....the image appears in the main page!
(6) Add some text, and to finish, just click 'Save'.
If you need to re-edit it later, just go to 'Edit This Page' again. You can experiment around as much as you like, until you're satisfied with the final version. Don't worry, you won't be criticised for your effort or anything like that, but your contribution will certainly be appreciated.
