Miscellany3
Contents
Miscellany 3
This page follows along the same aims in that of the original Miscellany page and the Miscellany 2 page -- that is, to include occasional images from LPOD that have been annotated to aid in discussion. If you would like to add an image relevant to an LPOD, then please see directions at end of this page for help (it's so simple). Visit also the fourth part of the Miscellany pages: Miscellany 4
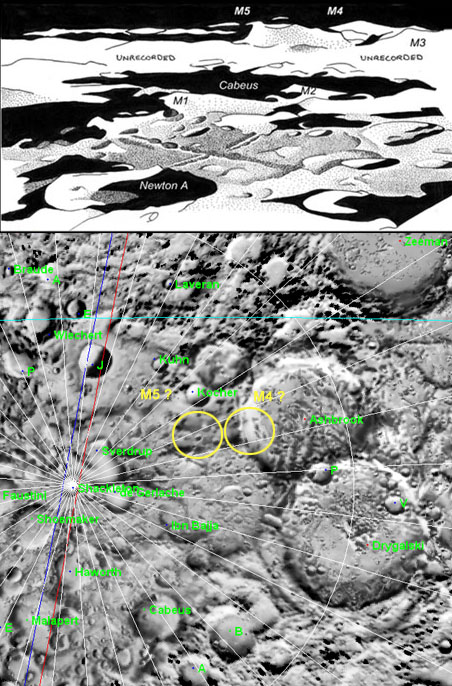
M4 & M5 ?
Image below shows a region around the South Pole. Top: Original image by Phil Morgan as presented on the LPOD. Bottom: Shaded relief aerial view of the area with names inserted using the LTVT software (note, the aqua-blue line running across the top is the observer's limb). In reference to 6 July 2009 LPOD.

  See also:
- December 19, 2007 LPOD, which has a topographic map (rotated ~180° from this one) with annotations by Paul Spudis identifying Whitaker's "M4" and "M5". - Jim Mosher
- LO-IV-179-H1 -- LOIRP restored image of the South Pole (13 August 2009).- JohnMoore2 JohnMoore2
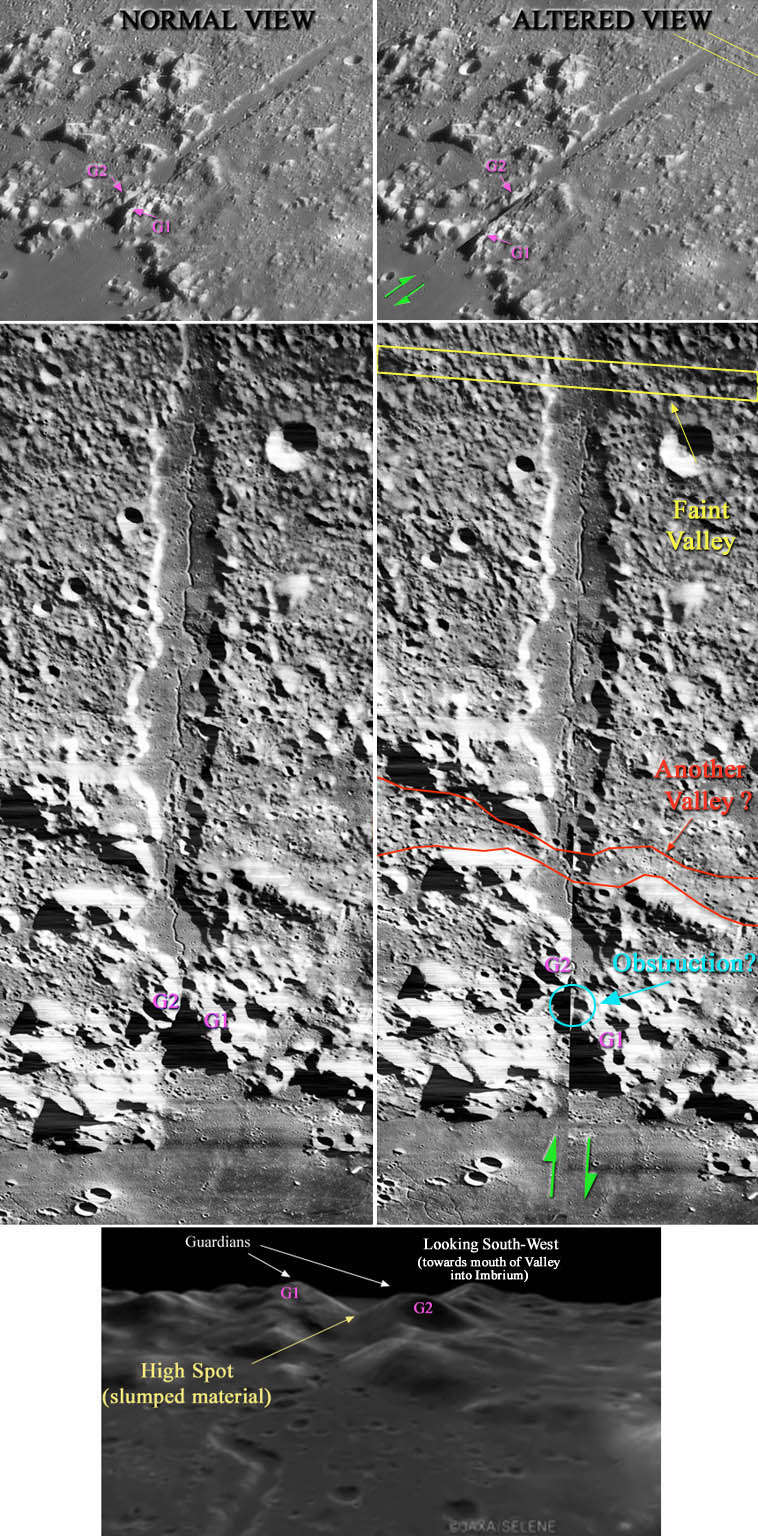
Alpine Valley
Image below shows Rick Smith's image (top), Lunar Orbiter 5 Frame 5102 (middle), and a frame taken from the Kaguya video (bottom). The left side side images show a normal view, while the right side show an altered view as proposed in the the LPOD ( 3 Aug 2009 ). The yellow line area represents Chuck's proposed valley, while the additional red line may hint at another. The Kaguya video is here (112 Mb) or YouTube version here.
Haemus Mts
The two images below show: (left) two marked regions that may represent massive piles of debris flung from the Imbrium impact; (right) a geological representation of the same area. If both marked piles came from the one souce at, roughly, the same time when the Imbrium basin formed, then why does one pile (bottom-marked pile) look more homogeneous in its topography than to the other (upper-marked pile) which shows a more groove-like appearance? See LPOD 21 Aug 2009 for an explanation.
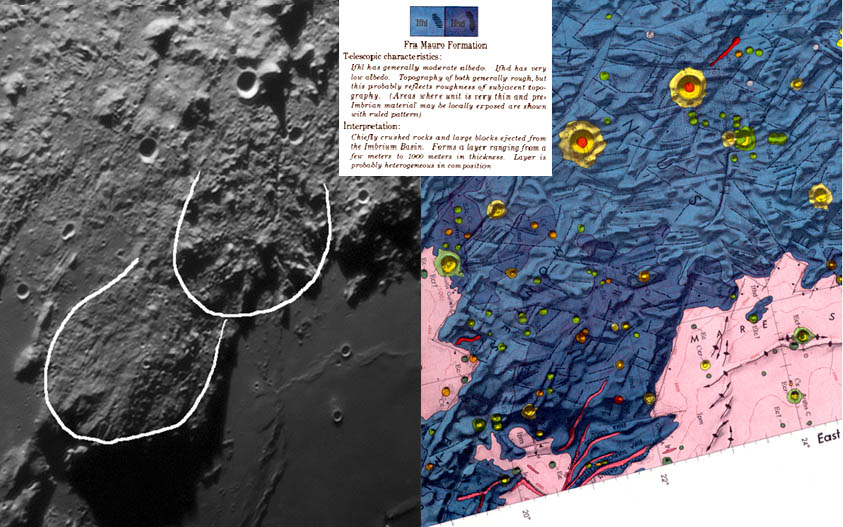
Image credit: Left: Stefan Lammel Right: LPI Geological Map
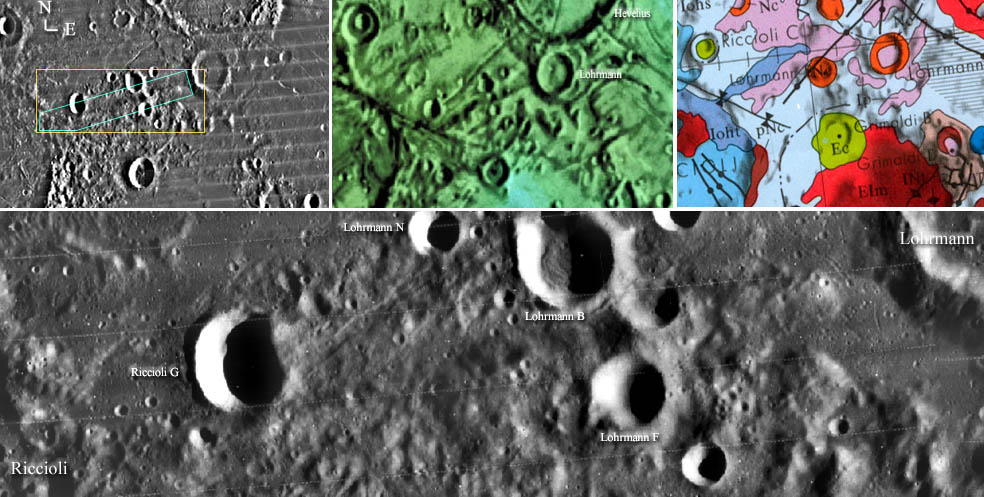
Miyamori Valley
Image below shows how the Miyamori Valley appears in a Lunar Orbiter Mosaic (top left and bottom), in a color-coded topographic map (top middle), and in a geologic map (top right). Note, in the bottom, high-rez image, dark bands in some areas may be due to development artefacts of the photo -- not to be confused with material surface makeup. In reference to LPOD Sept 4 2009. Back to discussion's page.

  Image credit: USGS Map-A-Planet and LPI
What mountain, rim?
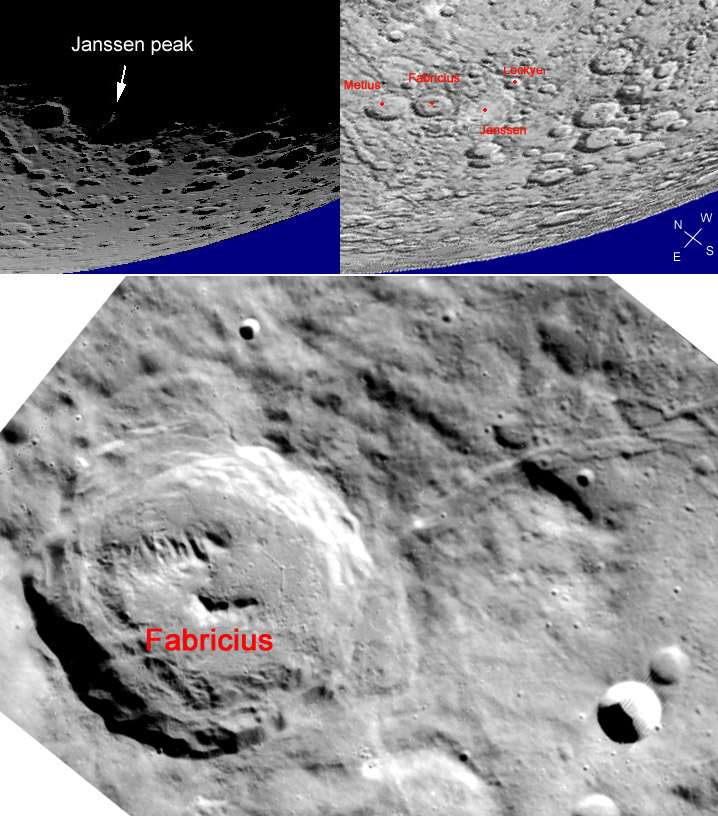
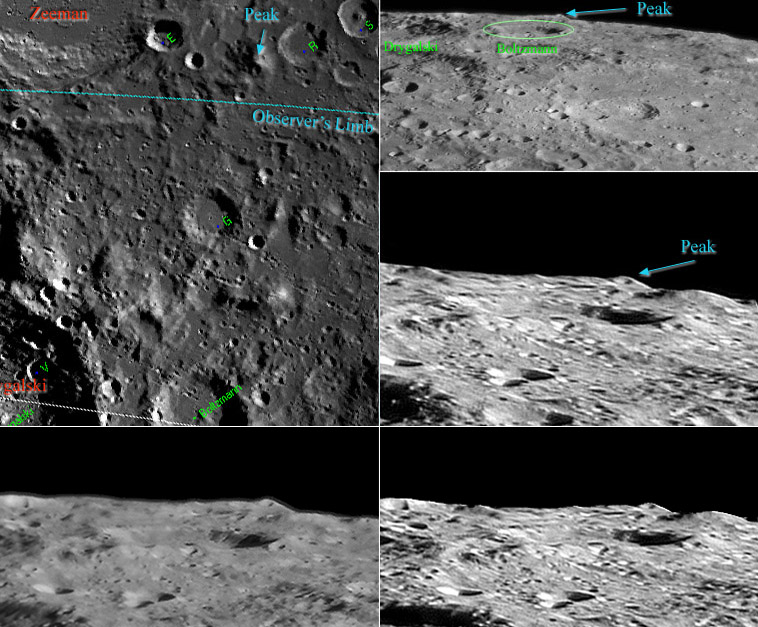
Image (top right) shows a nice peak feature on the near edge of the Moon seen in a larger mosaic image by Stefan Lammel -- a portion of which appears on the 7 Sept 2009 LPOD page. In the discussion's page of the above-mentioned LPOD, a query was posed where the exact location on the lunar surface the peak was related to? Now, thanks to Jim Mosher's direction to where a previous, but seperate discussion about the same feature had already developed, identification of the peak is solved -- clearly seen in the left-most, larger aerial-view image of the region attained by using the LTVT software. Incredible though it may seem, to this observer anyway, one would never have expected the peak in Stefan's image to be so far back, but it is, and it's location has been verified. Bottom-right image shows a portion of the same area from another photo previously taken by Harald Paleske that appeared on 16 Aug 2008 LPOD. As Stefan's and Harald's already-mentioned images show a slight displacement each in libration and view, the very bottom image shows an arranged combination of the two to see if any 3D effect would occur using the cross-eyed technique. For this observer, it works quite well while holding one's view approximately a foot from the screen -- the foreground terrain and Boltzmann show up quite nicely, but the peak is somewhat confusing.
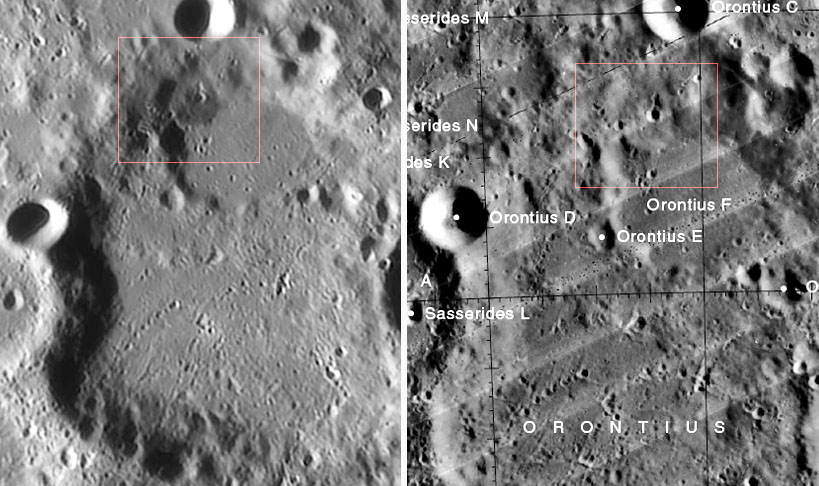
Dark region?
What is the cause of the curious dark region's appearance (red box) from a portion of Alex Sanz's image (left) of LPOD 11 Sept 2009 as posed by Danny Caes in the 12 Sept 2009 Discussion's page? (Right) Online LAC 112 image as a comparison of the same region under different lighting conditions.
Impact Basin?
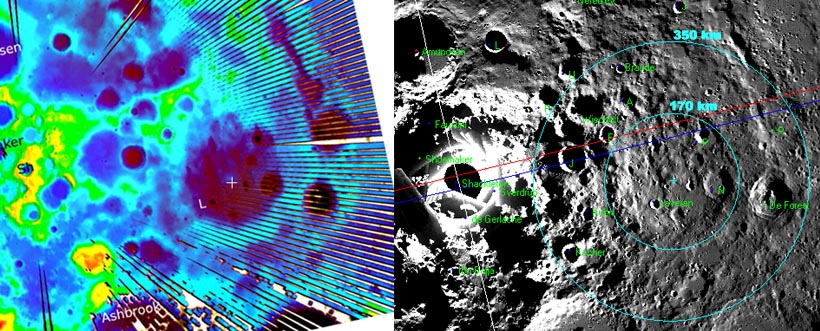
Picture below shows (left) the most recent LRO/LOLA image of the lunar South Pole region, while (right) the same area presented from a Clementine viewpoint. Using the LTVT software, diameters for the two rings (turquoise circles in right image) possibly associated to an impact basin in the region, as proposed by Chuck, came out at ~ 170 km (inner ring) and ~ 350 km (outer ring) respectively. In reference to LPOD 18 Sept 2009.
Janssen Peak
Image below gives an idea as to the region concerned producing the Janssen Peak -- as referenced in LPOD Nov 21, 2009. Bottom image, LO4-076H2, was orientated to suit the view.

  Image credits: (top left) Jim Mosher, (top right) Generated using LTVT, (bottom) LO4-076h2 from the Lunar & Planetary Institute.
Archimedes
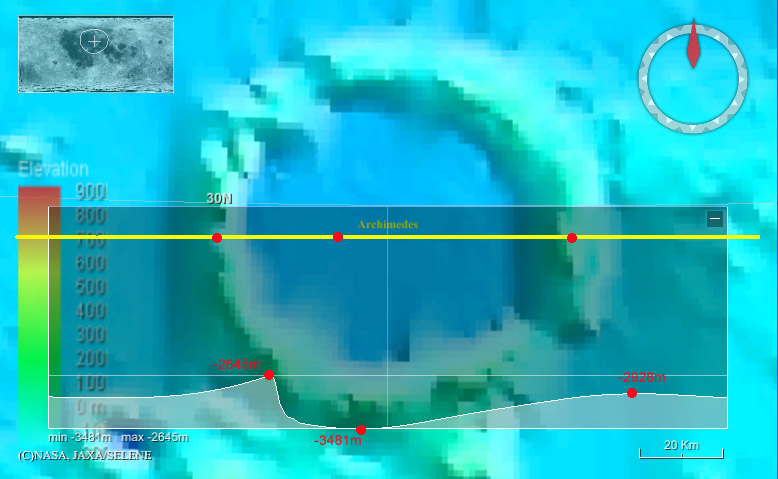
In reference to LPOD 22 Nov 2009.
  Image credit: Kaguya GIS data.
ADDING TEXT & IMAGE TO THIS PAGE
Just like as in the WikiMoon pages all you have to do is:
(1)Click on 'Edit This Page' above,
(2)Place the cursor on the page on where you want the image to appear,
(3)Click the green icon (just left of the blue-looking TV icon) on the top, and click on 'Upload Files' and 'Browse',
(4)Find the image in your own file system on your own computer, and open it,
(5)Clicking on 'Upload' will install a small version of your image, and to insert it all you have to do is do a 'double-click' on it -- you're done....the image appears in the main page!
(6) Add some text, and to finish, just click 'Save'.
If you need to re-edit it later, just go to 'Edit This Page' again. You can experiment around as much as you like, until you're satisfied with the final version. Don't worry, you won't be criticised for your effort or anything like that, but your contribution will certainly be appreciated.
