Difference between revisions of "LEND"
(Created page with "<div id="content_view" class="wiki" style="display: block"> =Lunar Exploration Neutron Detector (LEND)= <div id="toc"> =Table of Contents= <div style="margin-left: 1em">[#...") |
|||
| Line 9: | Line 9: | ||
<br /> | <br /> | ||
==Additional Information== | ==Additional Information== | ||
| − | * Recent LEND (2010):<br /> [http://the-moon. | + | * Recent LEND (2010):<br /> [http://the-moon.us/wiki/file/detail/lend-maps.jpg [[Image:lend-maps-small.jpg|lend-maps-small.jpg]]]<br /> Images above show just two map-views from recent '''LEND''' data as reported by [http://www.sciencemag.org/cgi/content/short/329/5998/1504 Anton Sanin] (''et al'') in last September's [http://www.lpi.usra.edu/meetings/leag2010/ LEAG] Meeting (2010). The maps are of the count rate of epithermal neutrons (neutrons having an energy in the range immediately above the thermal range, roughly between 0.02 and 100 electronvolts) at both the North and South lunar poles (above 80 degrees latitude). Blue areas represent Neutron Supressed Regions (NSRs) due to detection of increased Hydrogen signatures (of water-ice deposits?), while the gray and black colour contours represent surface relief and permanently shadowed regions. As of writing (24 Oct., 2010), while the above-mentioned areas found by '''LEND''' confirm those neutron suppression spots as discovered by the ''[http://lunar.arc.nasa.gov/ Lunar Prospector]'' mission back in 1998/99, the findings also have thrown light on relationships between individual PSRs and NSRs. For example: some PSR areas correlate very well with NSRs; other PSRs correlate in part (only) with NSRs that extend well beyond the shadowed regions; however, there are some PSRs that don't correlate at all with detected NSRs. Images credit NASA. ''Click for larger view.''<span class="membersnap">- [http://www.wikispaces.com/user/view/JohnMoore2 [[Image:JohnMoore2-lg.jpg|16px|JohnMoore2]]] [http://www.wikispaces.com/user/view/JohnMoore2 JohnMoore2]</span> |
<br /> | <br /> | ||
==LPOD Articles== | ==LPOD Articles== | ||
Revision as of 19:18, 11 April 2018
Contents
Lunar Exploration Neutron Detector (LEND)
Table of Contents
[#Lunar Exploration Neutron Detector (LEND) Lunar Exploration Neutron Detector (LEND)]
[#Lunar Exploration Neutron Detector (LEND)-Description Description]
[#Lunar Exploration Neutron Detector (LEND)-Description: Wikipedia Description: Wikipedia]
[#Lunar Exploration Neutron Detector (LEND)-Additional Information Additional Information]
[#Lunar Exploration Neutron Detector (LEND)-LPOD Articles LPOD Articles]
[#Lunar Exploration Neutron Detector (LEND)-Bibliography Bibliography]

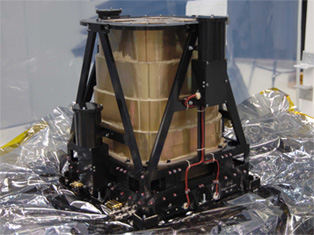
Left: Credit: NASA - photo of LEND instrument.
Description
The LEND instrument is a payload onboard the [/LRO Lunar Reconnaissance Orbiter] spacecraft that launched to the Moon on 19 June 2009. Consisting of nine detectors to measure fluxes of thermal, epithermal, and fast neutrons (produced from continuous cosmic ray bombardment of the lunar surface), LEND has the ability to detect water-ice deposits in Permanently Shadowed Regions (PSRs) at both lunar poles, and map hydrogen distribution (~ 100 ppm) in the shallow subsurface down to a resolution of 5 km. The Russian-made instrument is the first collimated neutron instrument to ever fly in space.
Description: Wikipedia
Additional Information
- Recent LEND (2010):

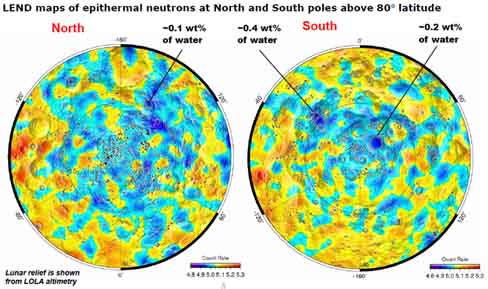
Images above show just two map-views from recent LEND data as reported by Anton Sanin (et al) in last September's LEAG Meeting (2010). The maps are of the count rate of epithermal neutrons (neutrons having an energy in the range immediately above the thermal range, roughly between 0.02 and 100 electronvolts) at both the North and South lunar poles (above 80 degrees latitude). Blue areas represent Neutron Supressed Regions (NSRs) due to detection of increased Hydrogen signatures (of water-ice deposits?), while the gray and black colour contours represent surface relief and permanently shadowed regions. As of writing (24 Oct., 2010), while the above-mentioned areas found by LEND confirm those neutron suppression spots as discovered by the Lunar Prospector mission back in 1998/99, the findings also have thrown light on relationships between individual PSRs and NSRs. For example: some PSR areas correlate very well with NSRs; other PSRs correlate in part (only) with NSRs that extend well beyond the shadowed regions; however, there are some PSRs that don't correlate at all with detected NSRs. Images credit NASA. Click for larger view.- JohnMoore2 JohnMoore2
LPOD Articles
Bibliography
- Mitrofanov, I, et al (2010). Main Results from LEND Instrument After 1 Year of Lunar Mapping Onboard NASA’s LRO Mission - LEAG Meeting (2010).
- Sanin, A. et al (2010). Which Spot on the Moon has the Highest Content of Hydrogen? - LEAG Meeting (2010).
- Boynton, W, et al (2010). Relationship Between Hydrogen‐enriched Areas and Permanently Shadowed Regions Near the Lunar South Pole - LEAG Meeting (2010).
- Keller, J. et al (2008). Luanr Reconnaissaince Orbiter: Instrument Suite and Objectives 2008.
This page has been edited 1 times. The last modification was made by - tychocrater tychocrater on Jun 13, 2009 3:24 pm - afx3u2siondate} - afx3u2ondate} - afx3u2